INTERACTIVE ART PROCESS
The first step was to create a canvas element to draw on, which is the dark gray square in the image below. When the user holds down his/her mouse, we start drawing a random line on the canvas until mouse is released. At this stage, the mouse's location (beyond the location of the initial click) is not taken into account, so the direction is purely random. After each iteration, the line has a one in four chance of travelling in each of the four cardinal directions, painting the pixel that it lands on opaque white. Also, it takes quite a long time to paint even a small area since only one pixel is being painted every 5 milliseconds.
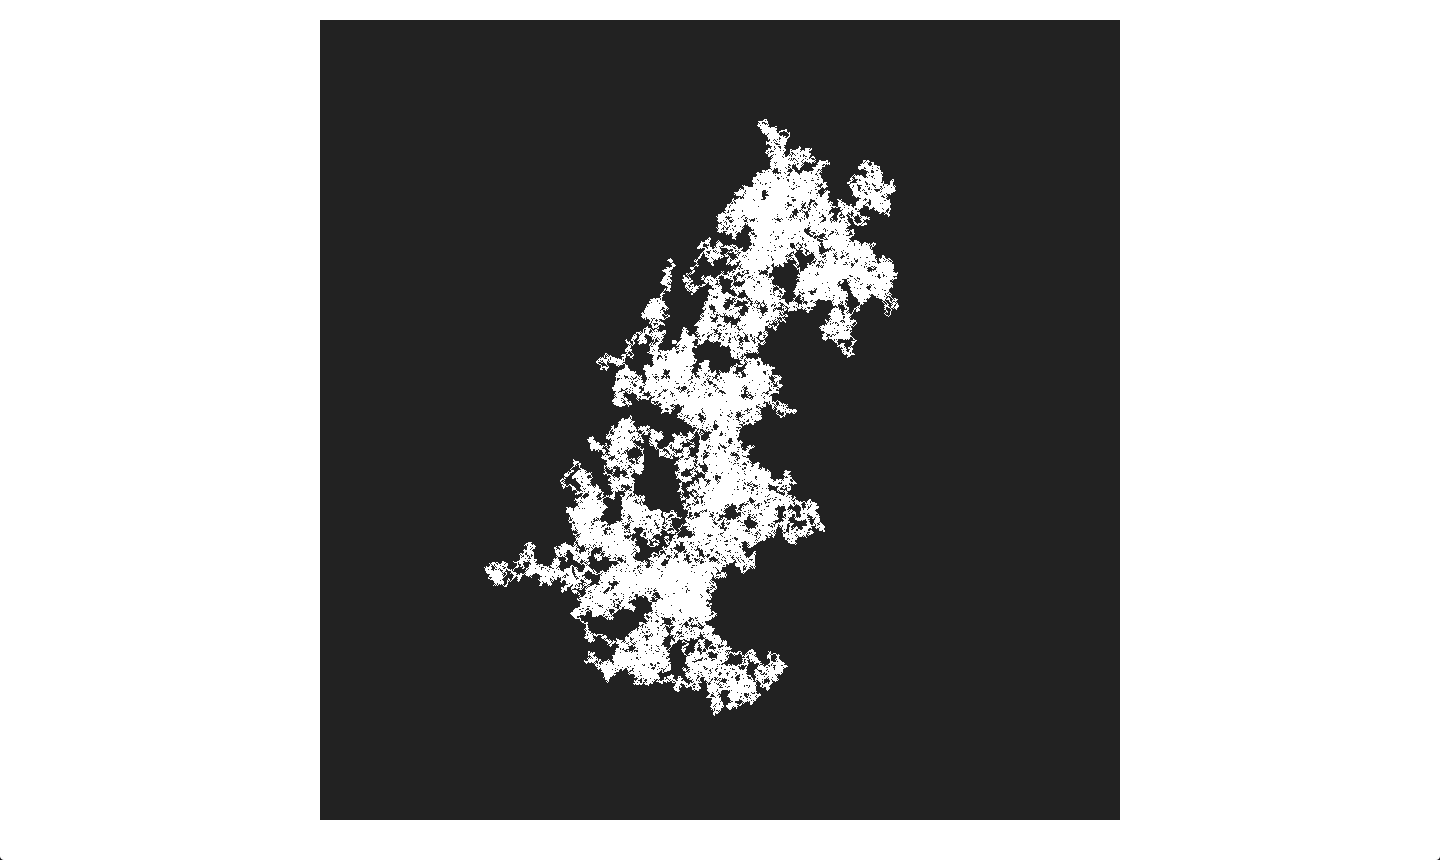
The following image shows what the image would looks like after a significant time is spent painting a single line. As you can see, it is difficult to tell where the line has travelled since it all becomes one huge white lump. Not very interesting.
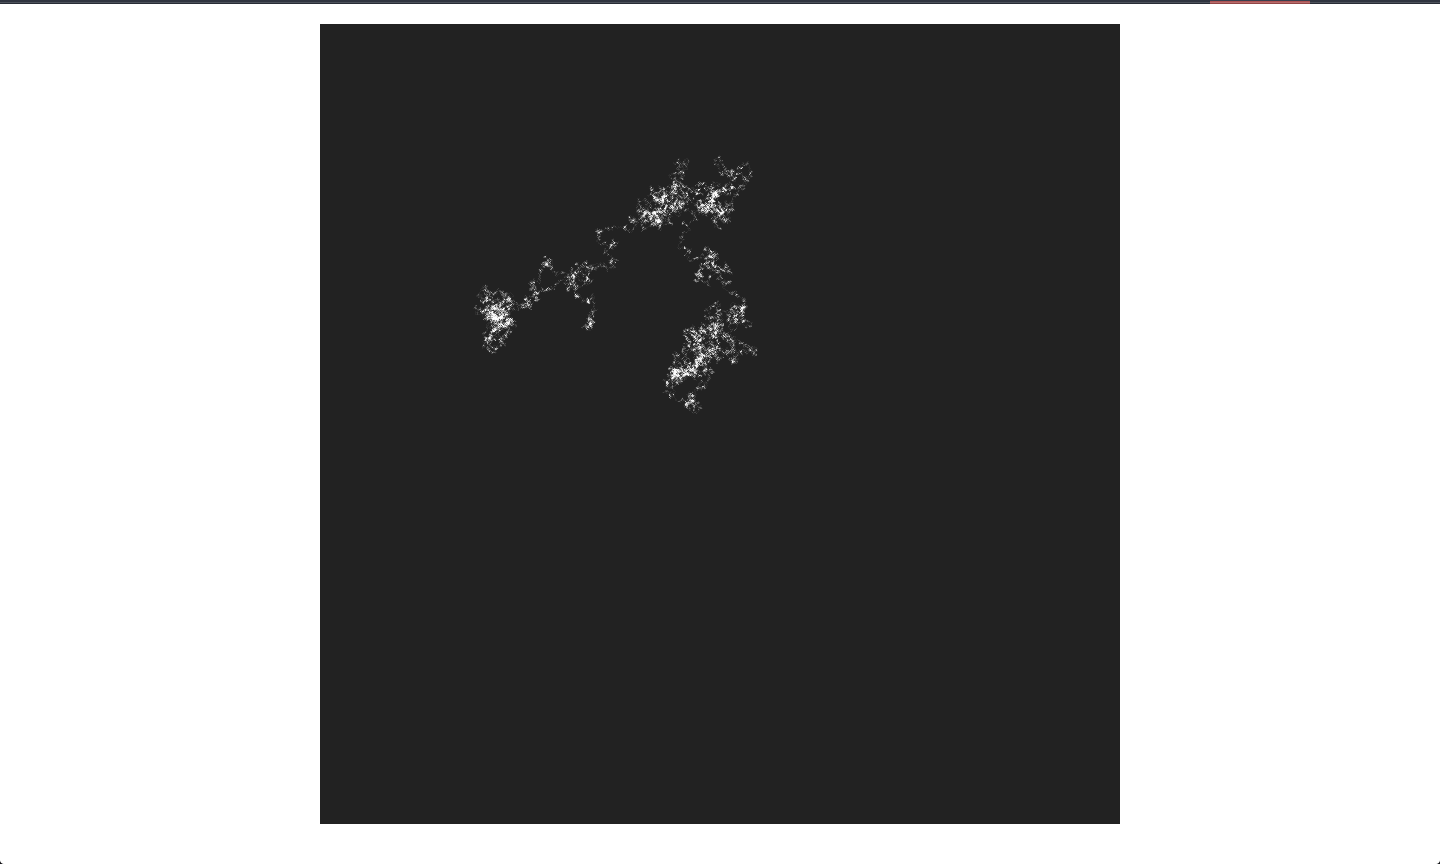
A new element, opacity, is now added into the picture. Now, whenever the line goes over a pixel it paints over the pixel the color white with 5 percent opacity. This means that the more instances that the line visits the same pixel, the "darker", or more white, that pixel will be. This addition adds a feeling of depth and makes the generated image look much more organic.
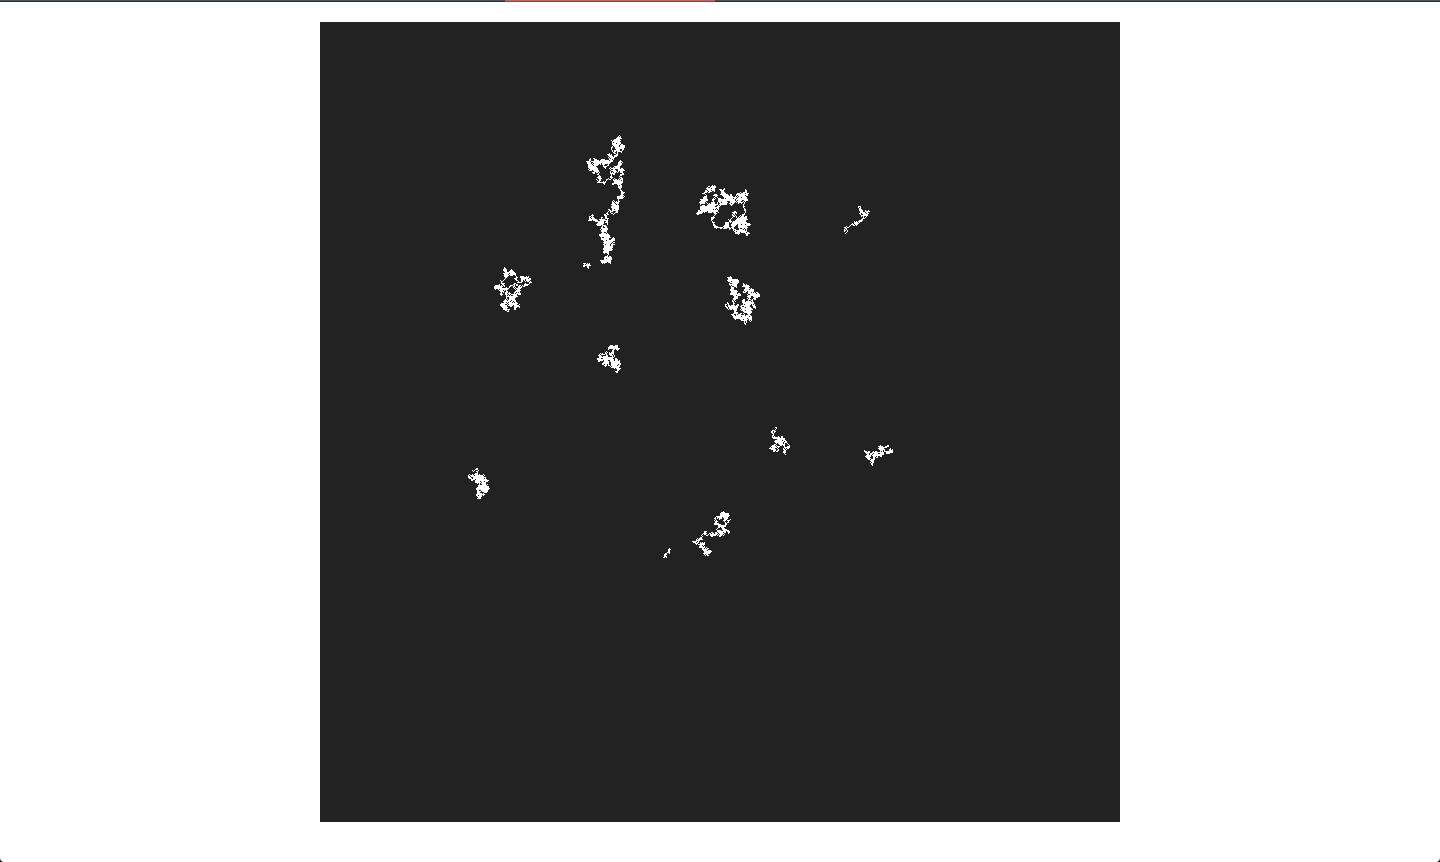
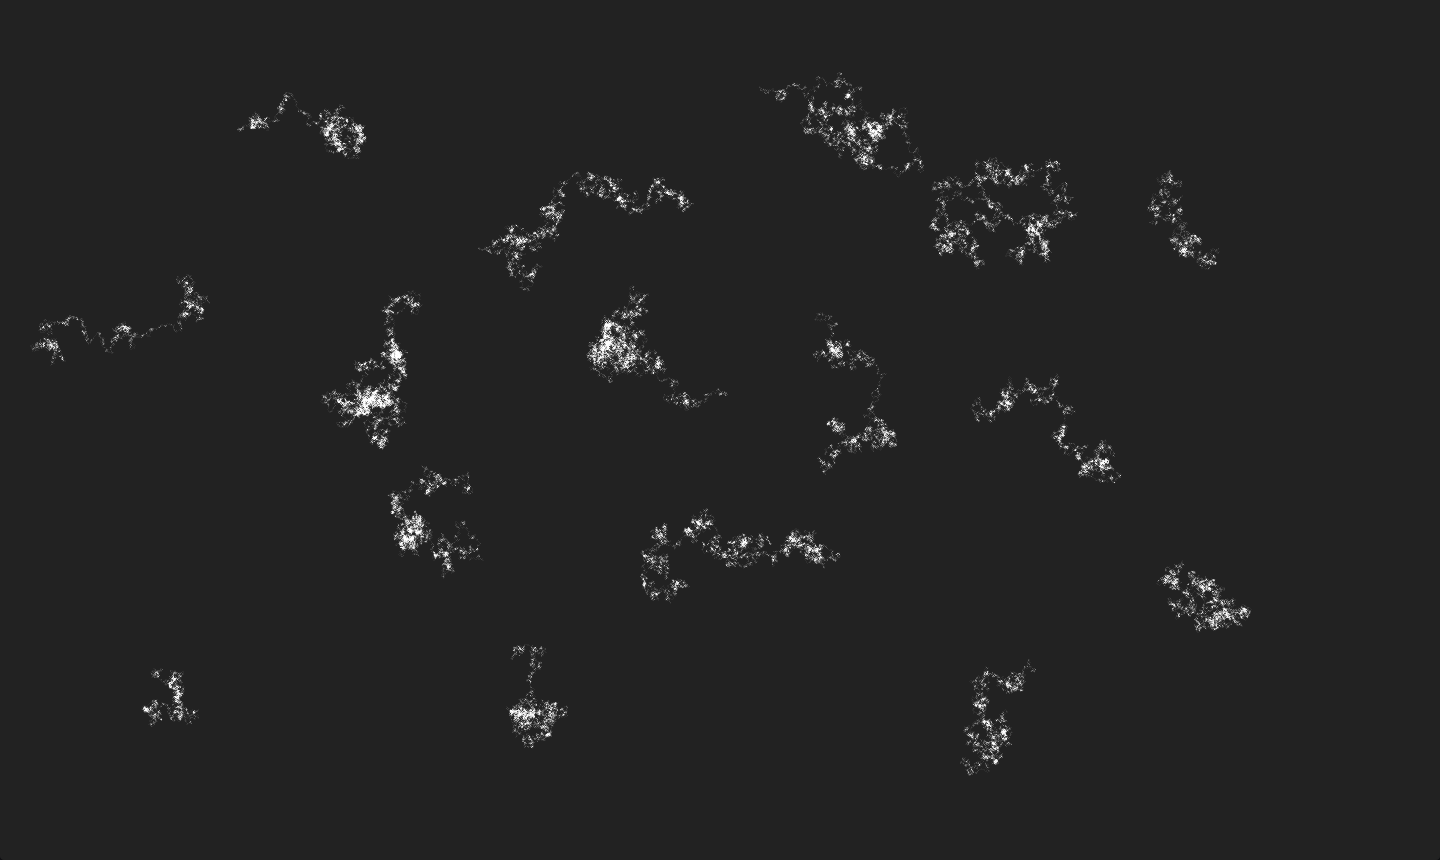
Next, the canvas is widened to cover the entire screen to provide for a more immersive feeling. The following image shows a simple design with several different lines started at various locations around the canvas.
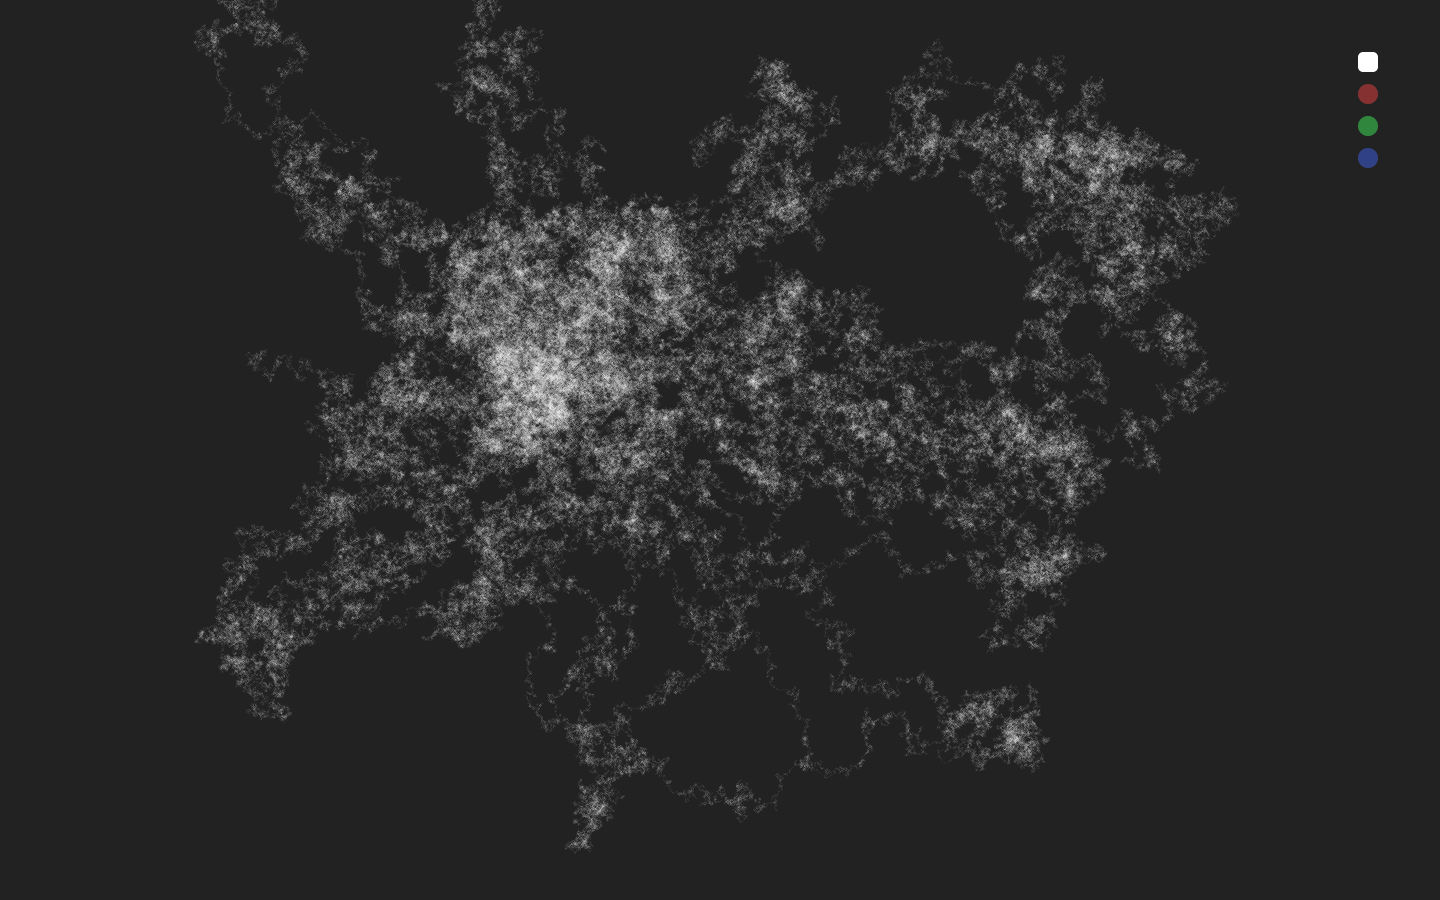
Next, I added the ability for the line to "follow" the user's mouse, while still remaining random. This process was rather difficult, and I ended up using a sigmoid function spanning from -1 to 1 and centered around the origin, i.e for x representing the x distance from the end of the line to the position of the mouse, 2/(1+e^(-x)-1, with a modifier on x = to 1/1400 pixels, to calculate the probability that the line should move towards the mouse instead of where it would have moved. This function, shaped like an S, approaches 1 the higher the value of x is, and approaches -1 the more negative the value of x is, which is exactly what we want. The modifier of 1/1400 pixels on x is to make sure that the probability isn't too close to 1, otherwise there would be no randomness. However, if the modifier is too small, then the user would have less control over the line. This process was repeated for y representing the vertical distance from the starting point to the mouse position. An interesting aspect may be to have the user be able to control this value to increase or decrease the randomness of their art at will.
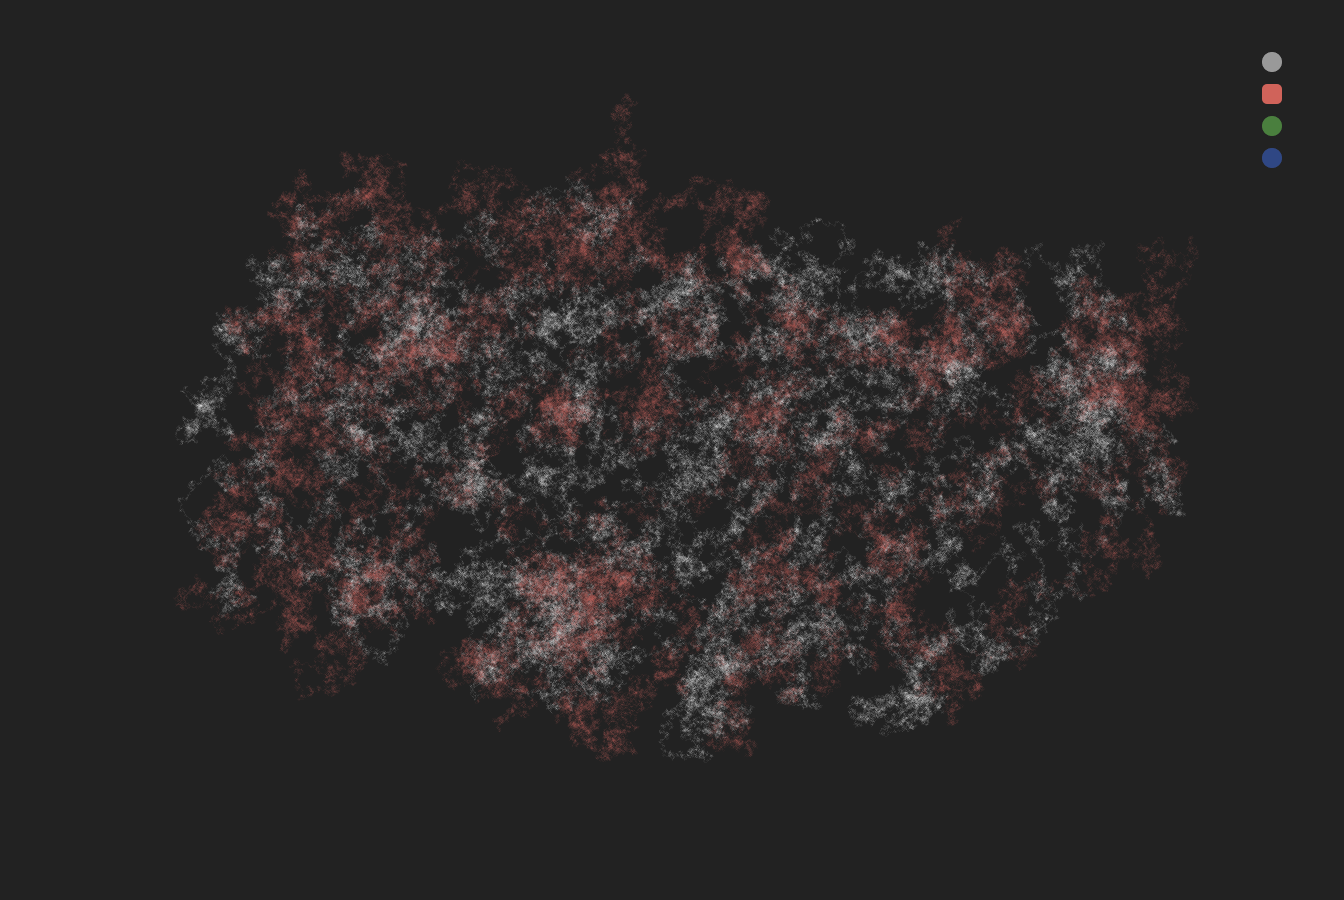
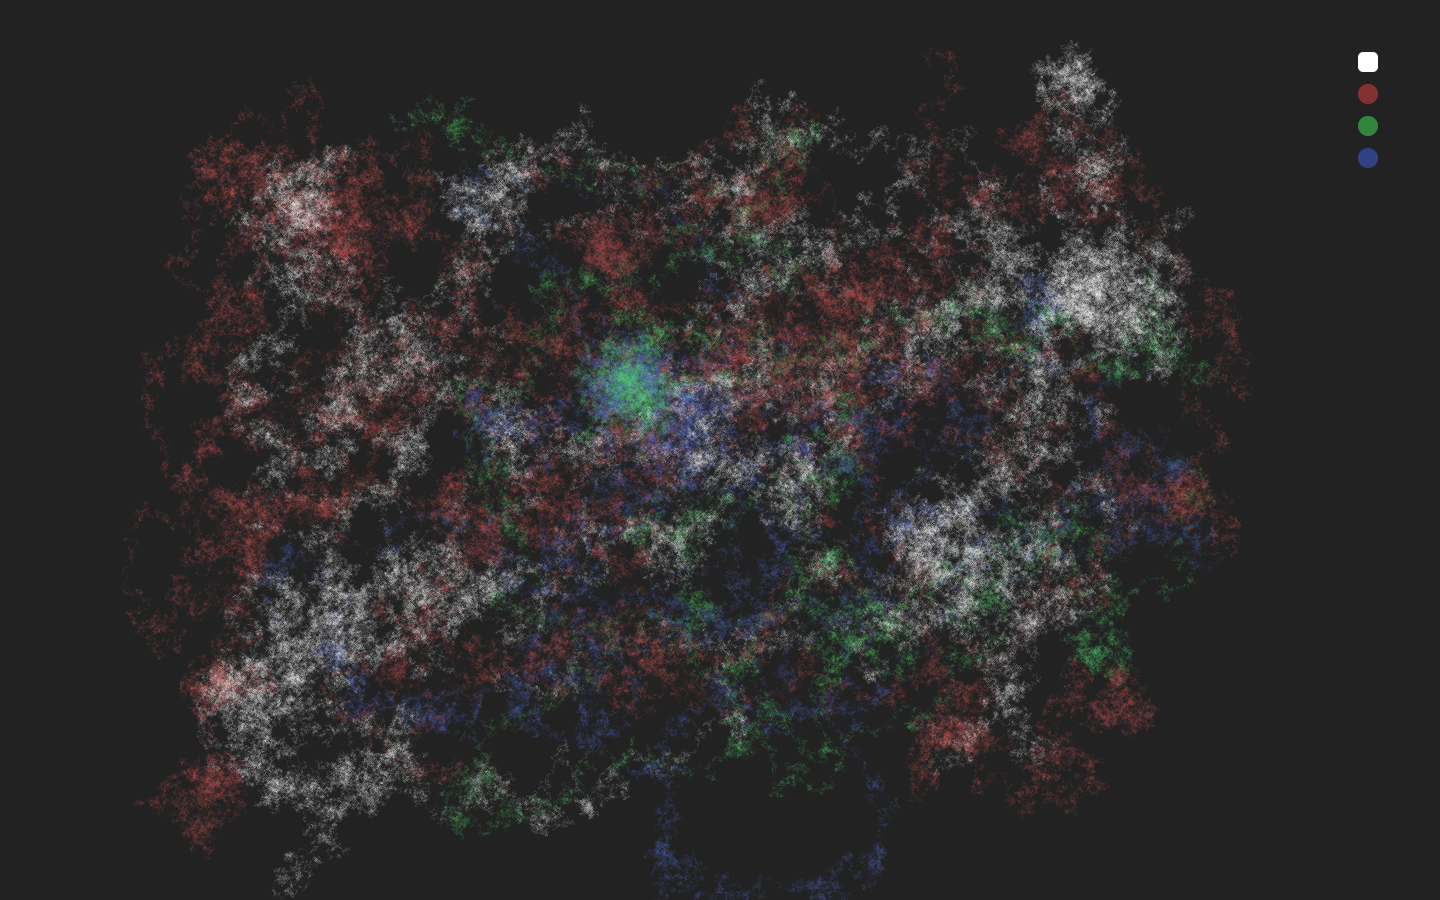
This last step as to add colors to the project. This was fairly easy, and a drop down menu was added to the upper right hand corner to switch between four basic colors. All of the colors had very similar brighnesses and saturations in order to make for a consistant final image. As can be seen in the below image, the colors overlap each other fairly nicely with their 5 percent opacities.
DATA VISUALIZATION PROCESS
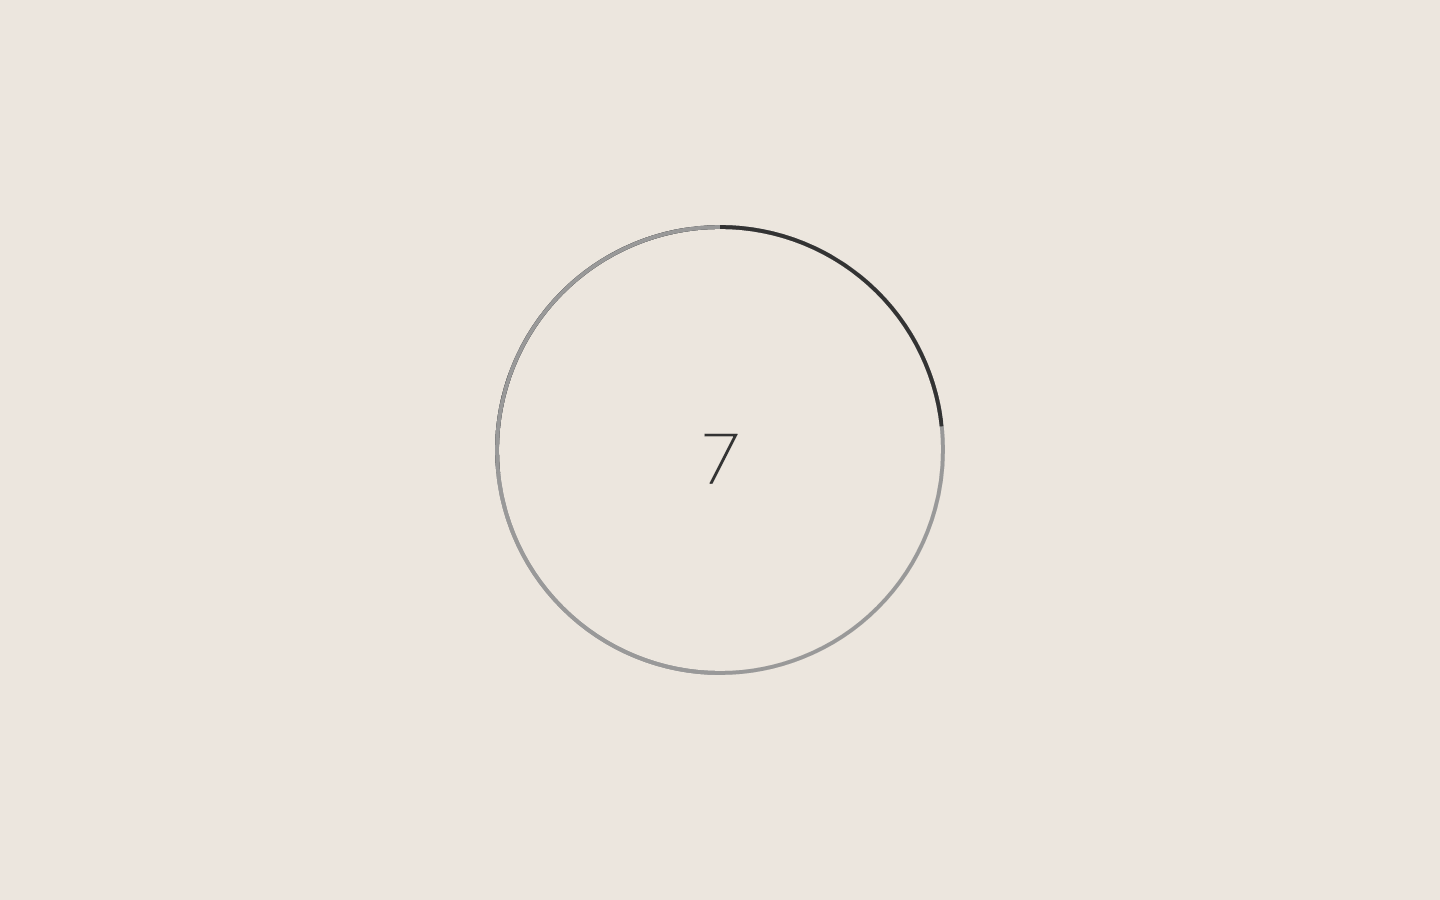
The first step was making the circle clock, and this was probably the most difficult part. I had to divide the clock into two halves, left and right, and progressively obscure a percentage of the first half with a mask until the entire first half was covered. Then, the second half was revealed and the mask was covered on the first half and the same process was repeated for the second half. And every time the spacebar was pressed, the mask would progress 1/30th of the circle, representing one second out of 30.
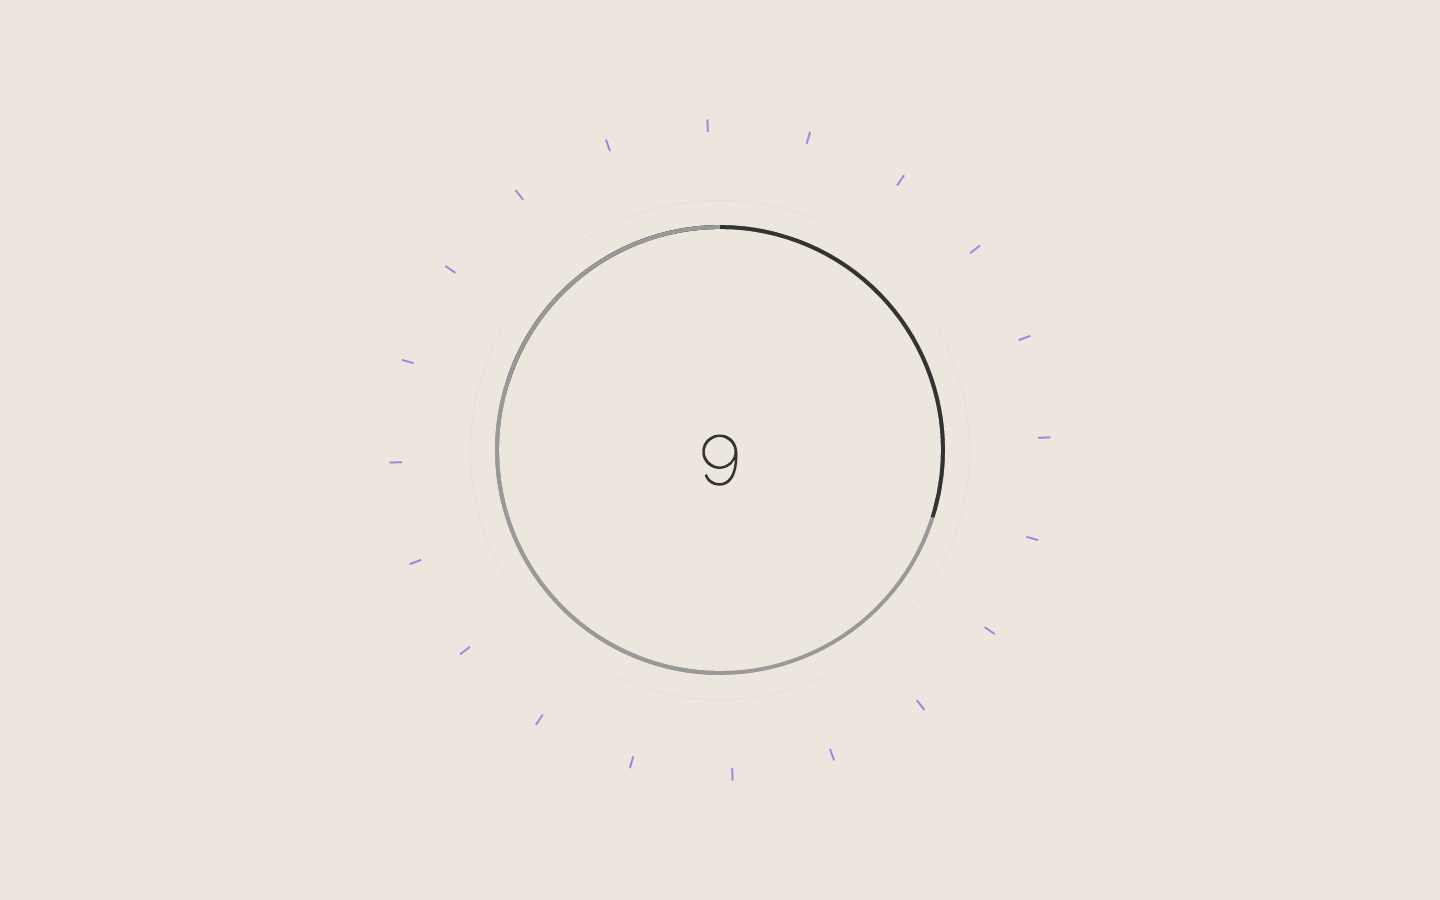
Next I added a light animation every time the user progressed the clock. For this, I used a Javascript library called Mo.js to create a burst animation of purple lines. One downside to this is that the user may use the animation to help them time the seconds, however, when I tried this, I still got similar results because it was hard to see when the animation truely ended.
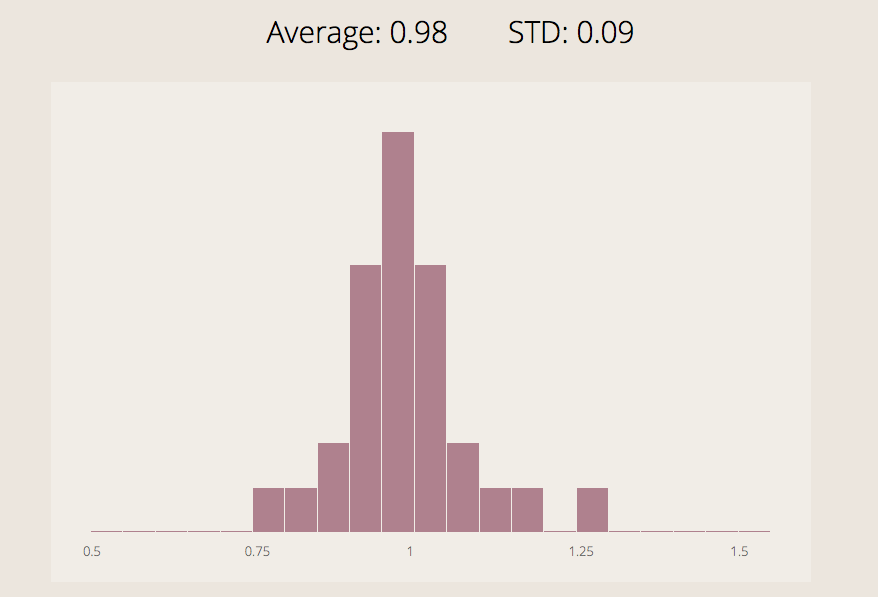
The next image shows the finished product, which is a histogram of the total time between space presses, which represents the distribution of how long the user thinks a second is. As you can see from the below image, which is a distribution of my times, people are generally good at guessing how long a second is, and the distribution is fairly normal with a low standard deviation.
MINESWEEPER PROCESS
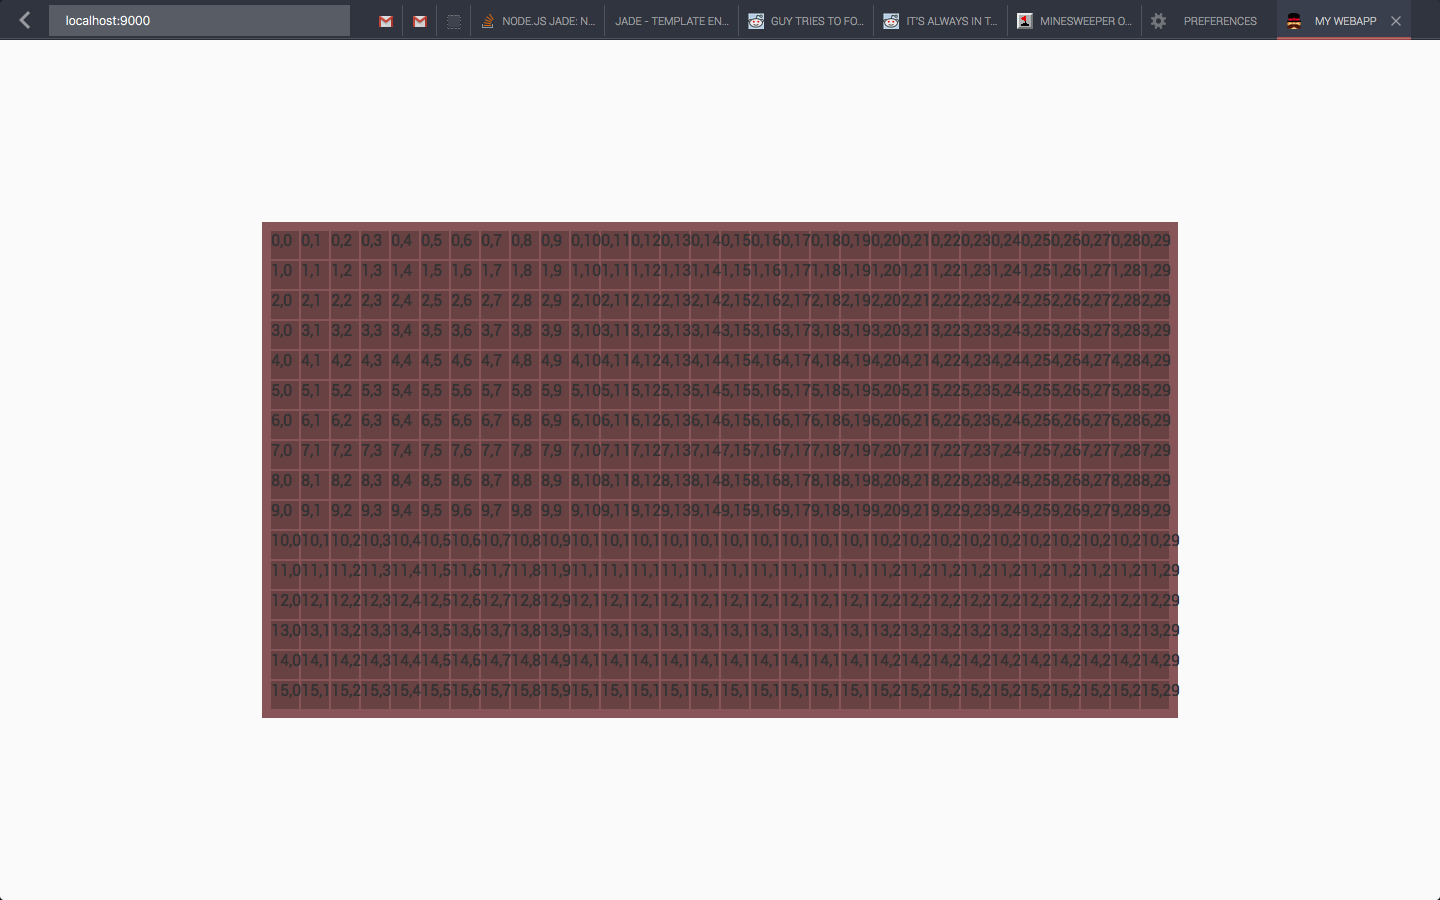
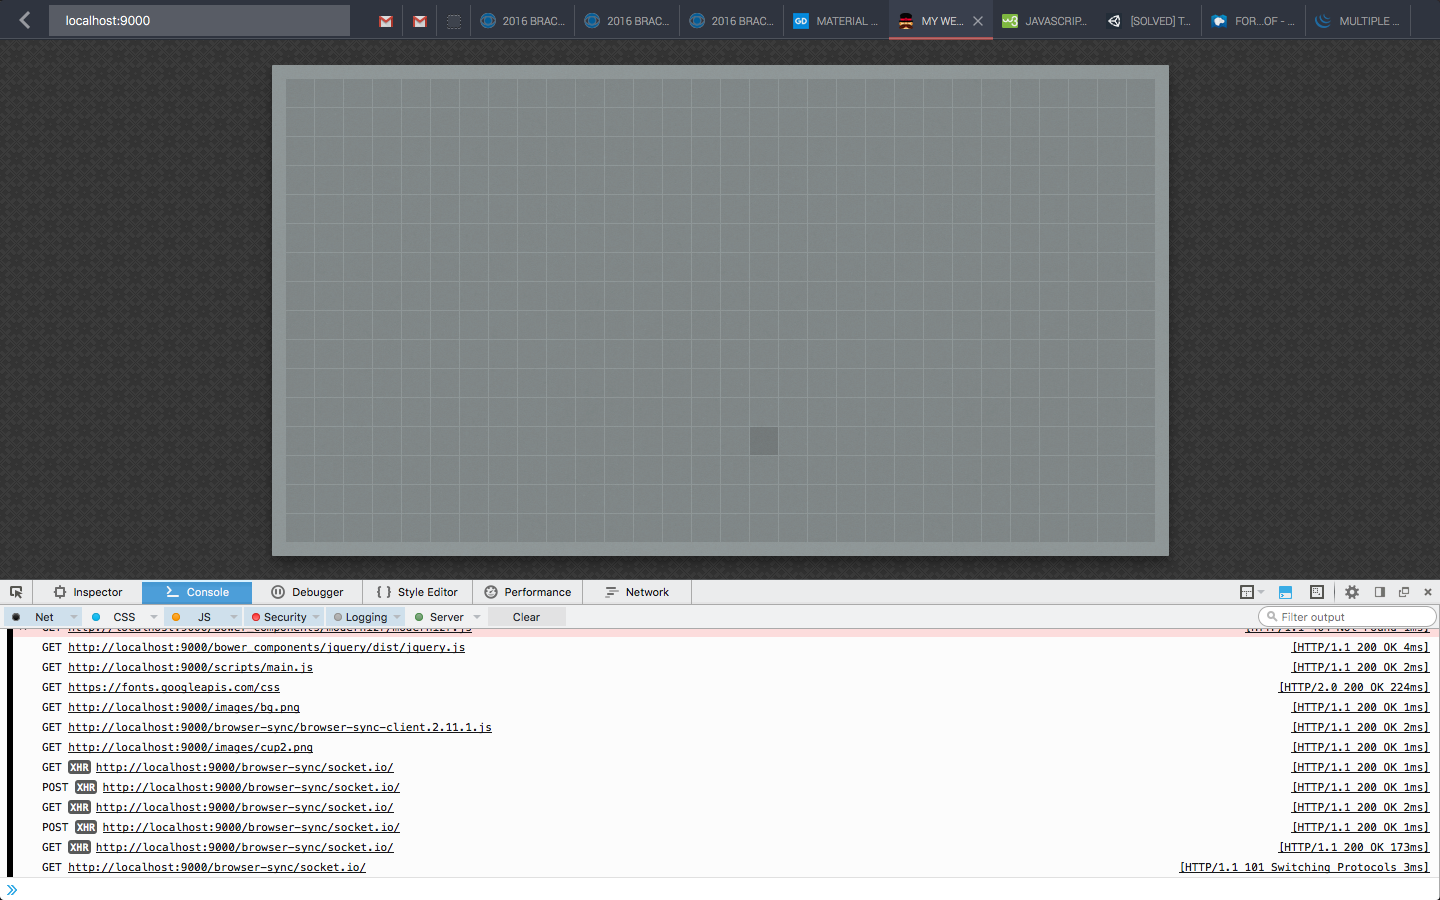
The first step was setting up a grid of html elements to build off of. Since I didn't want to manually create 480 divs, I used a templating engine called Jade to create a 16 by 30 array of tiles. The below image shows me numbering the tiles based on their coordinates.
Next, I set up some initial styling for the game, setting the background to a darker color and the tiles to a cool blue color.
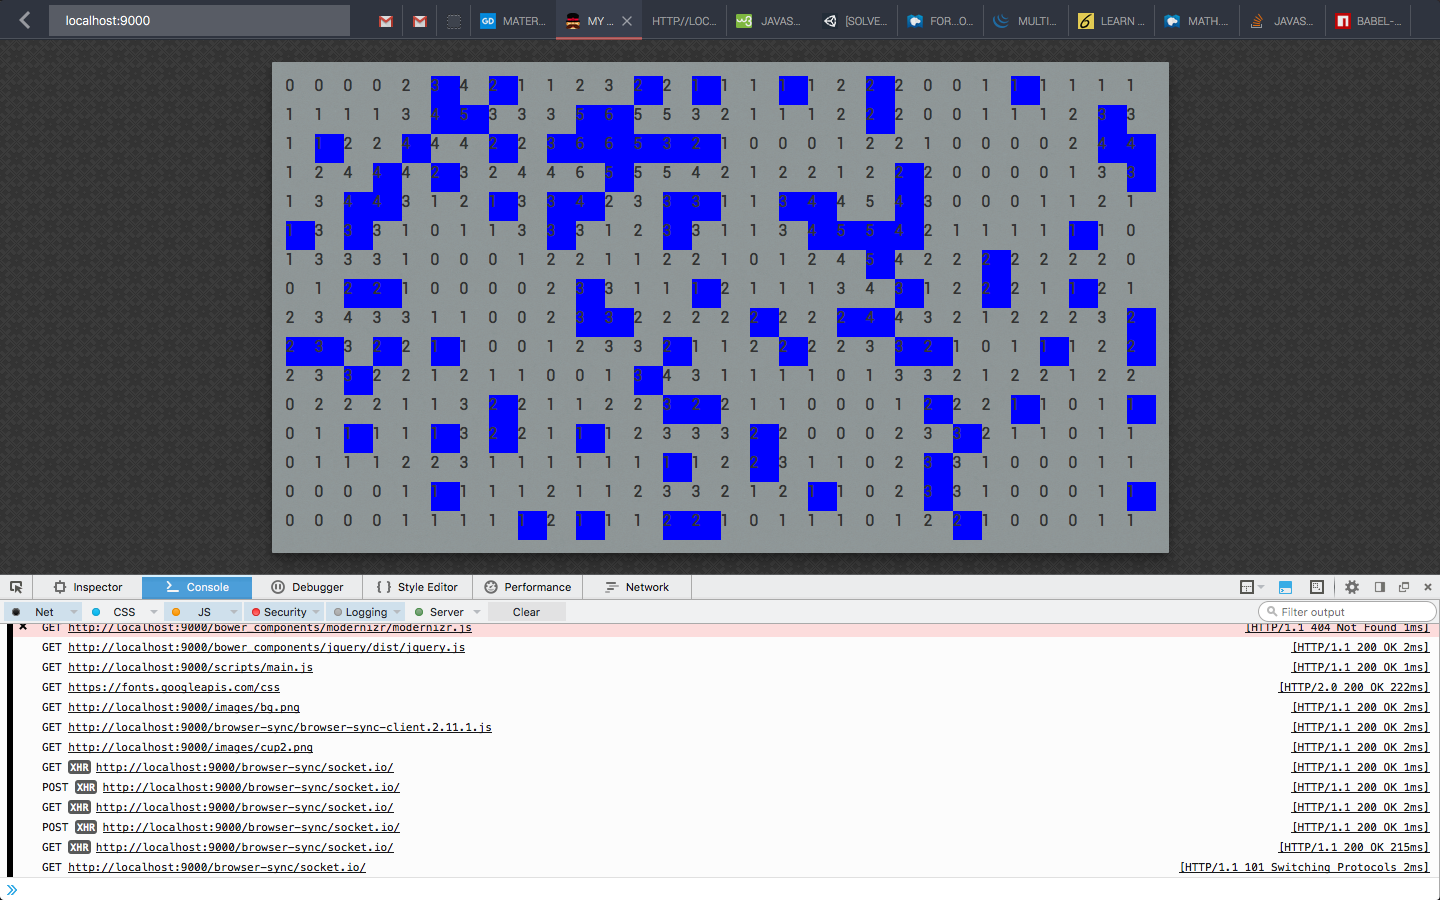
The board generation algorithm was then created, which randomly places 99 bombs around the board, the loops through each tile and counts how many bombs are adjacent to each tile. For debugging purposes, the bombs are displayed as a blue background and all of tile numbers are visible.
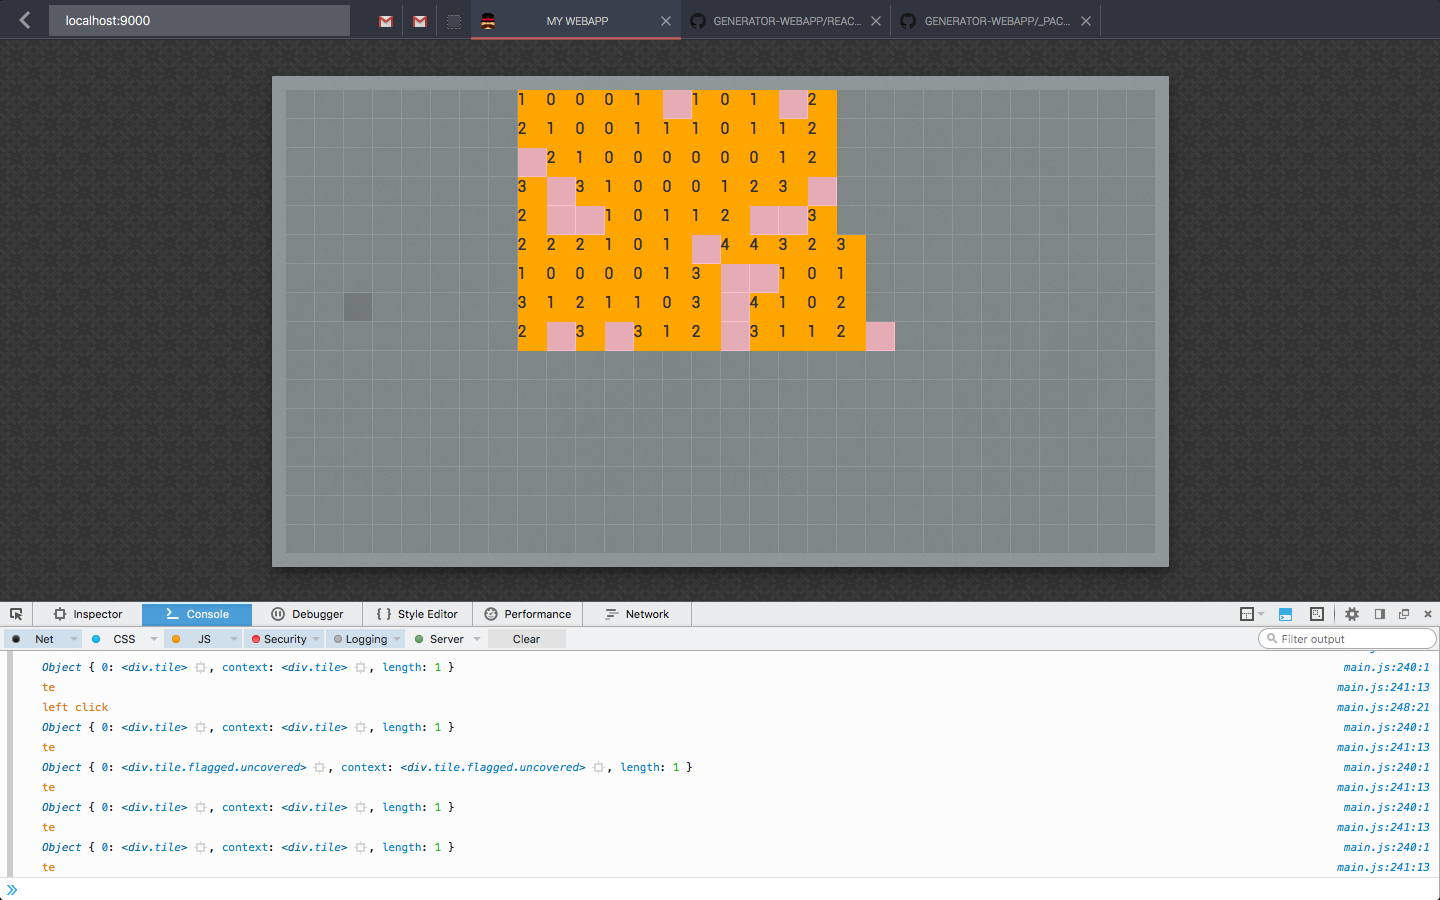
Now, all of the tiles are initialized to being covered, and once the user clicks on a tile, it uncovers the number underneath it. If that number is a zero, meaning that there are no bombs around that tile, the same uncovering process is repeated for every tile adjacent to the selected tile. Additionally, if the user right clicks on a tile, the tile is flagged, meaning that there should be a bomb under there. For now, flagged tiles are shown as pink tiles.
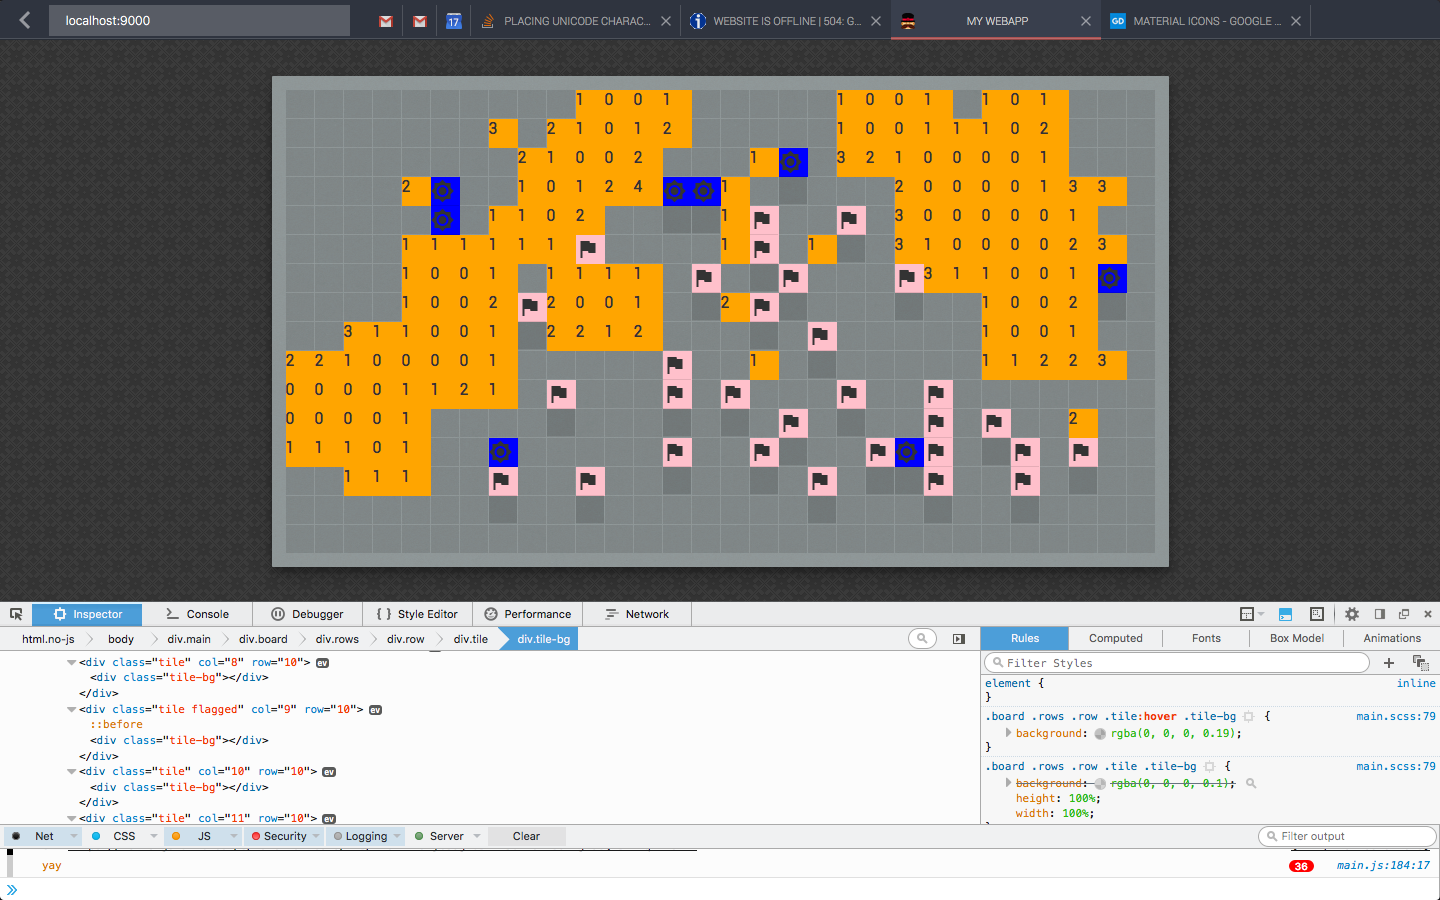
In the next image, i add flag icons to the flagged tiles, and bomb icons to the bomb tiles. These icons are from Google's Material Design icon set, and since there was no designated "bomb" icon, I used the icon for full brightness, which looked like a bomb. For easy identification purposes, bombs were colored in blue like before
The next image shows the board after a more refined styling process. The whole page is now colored a darker blue color and the numbers are colored in neon green, and zeroes are no longer displayed for simplicity. Uncovered tiles are slightly lighter than their surroundings to make it easier to recognize how far you are in the puzzle.
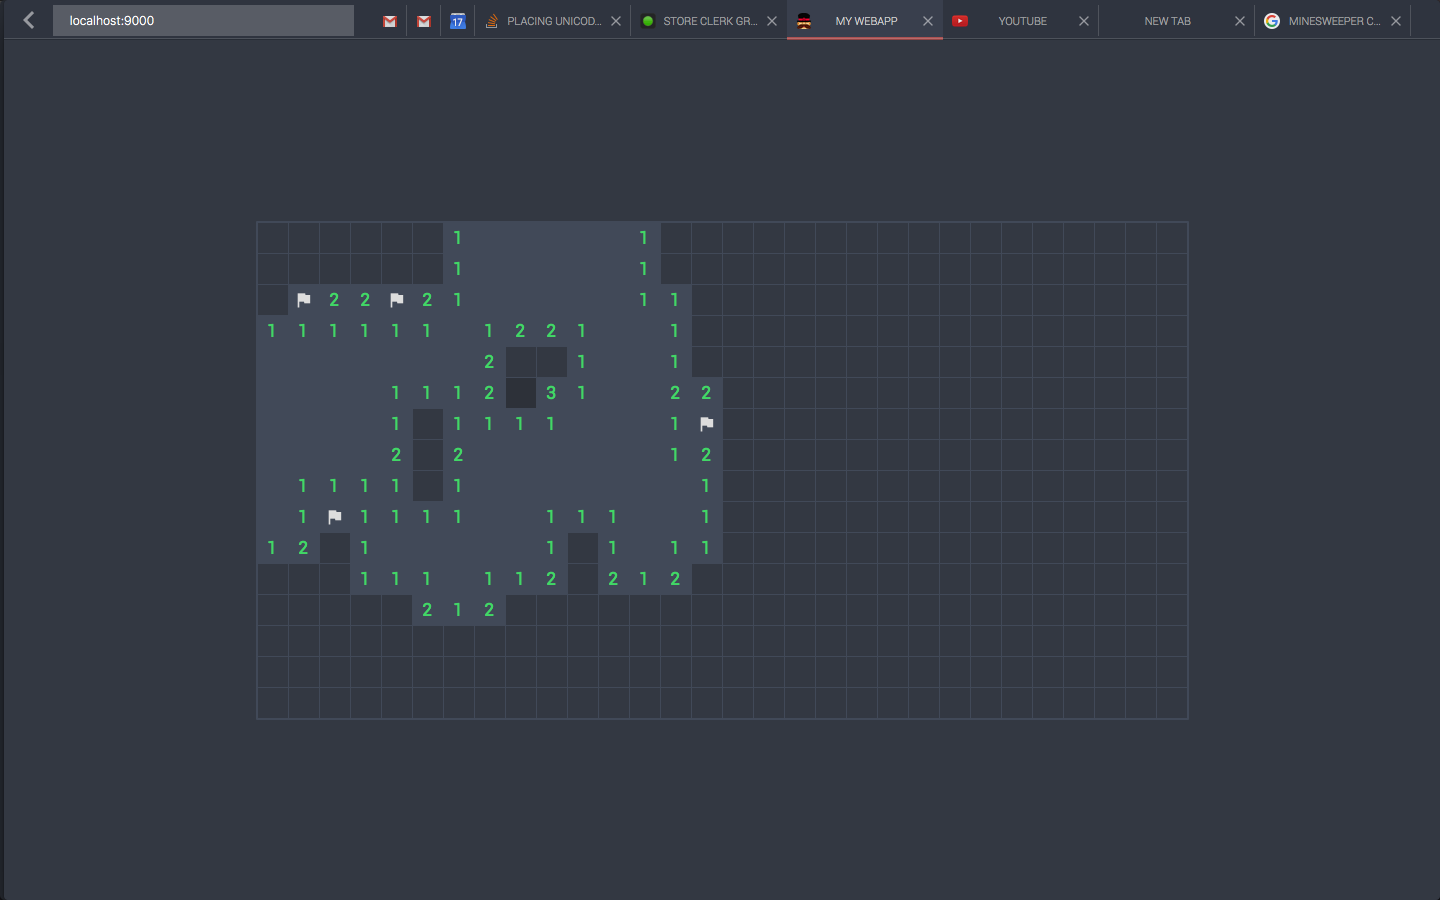
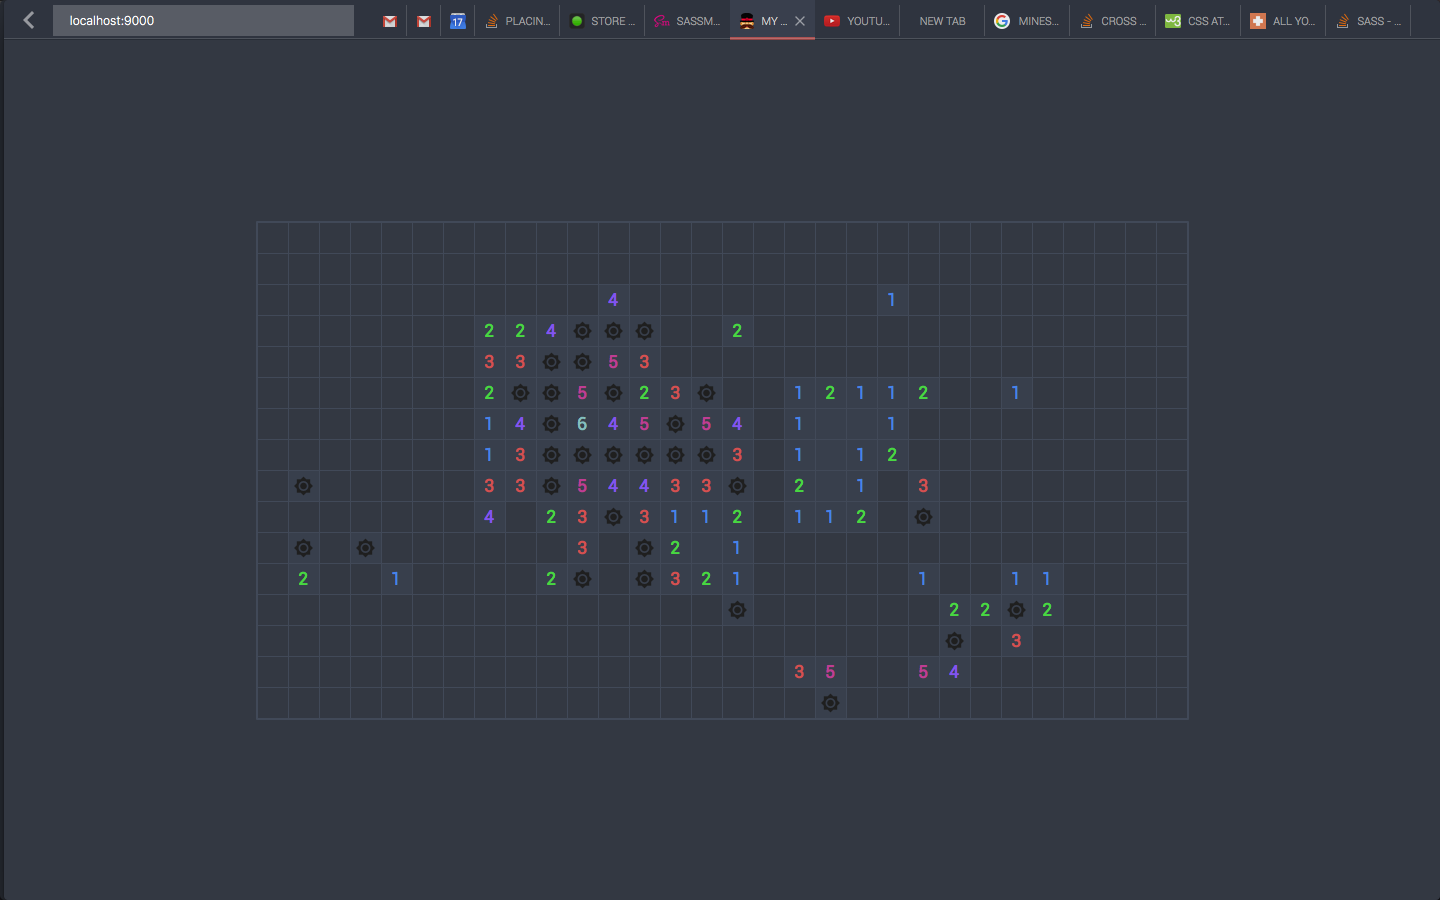
I then add coloring to all of the different possible tile numbers, ranging from 1 to 8. I tried to make all of the colors have a similar level of saturation and lightness to make the overall look appear themed and neon. At this stage, the bombs (visible after you messs up) are colored in dark gray, whcih makes them hard to make out. I eventually change them to be colored white.
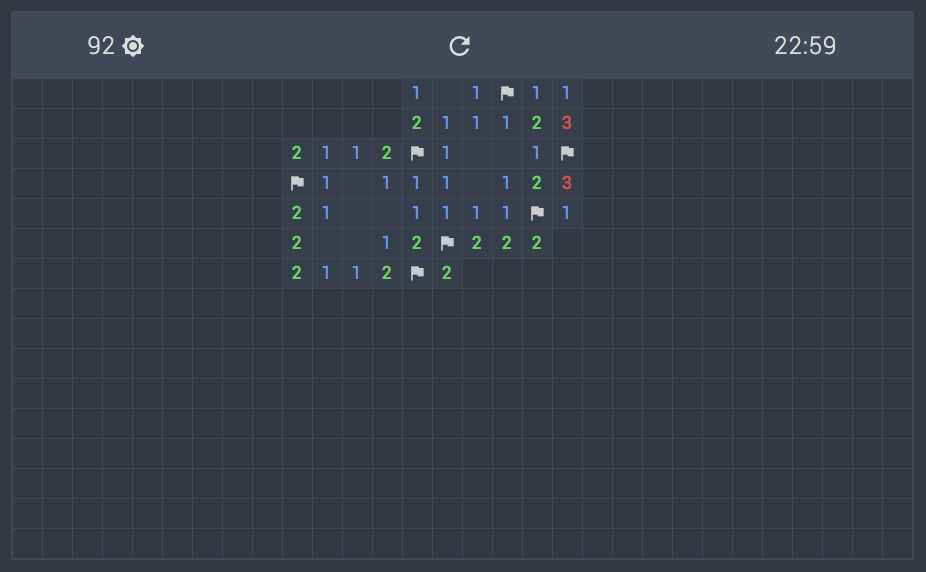
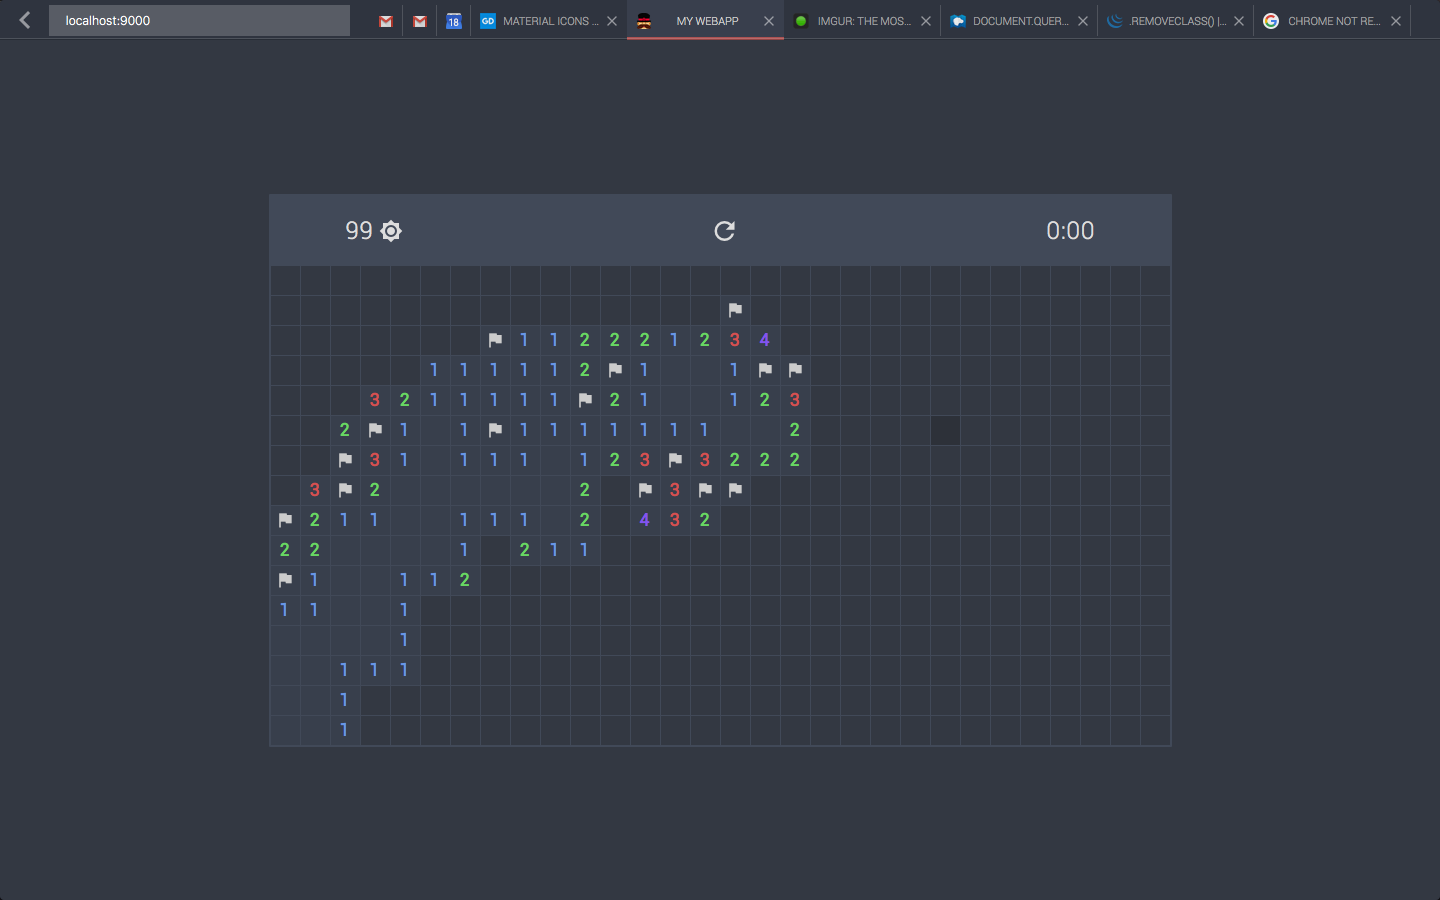
The following image shows the finished version of the game in progress. I've also added an info bar along the top of the grid which displays the number of remaining bombs, a reset button, and how much time the user has spent so far on the puzzle.
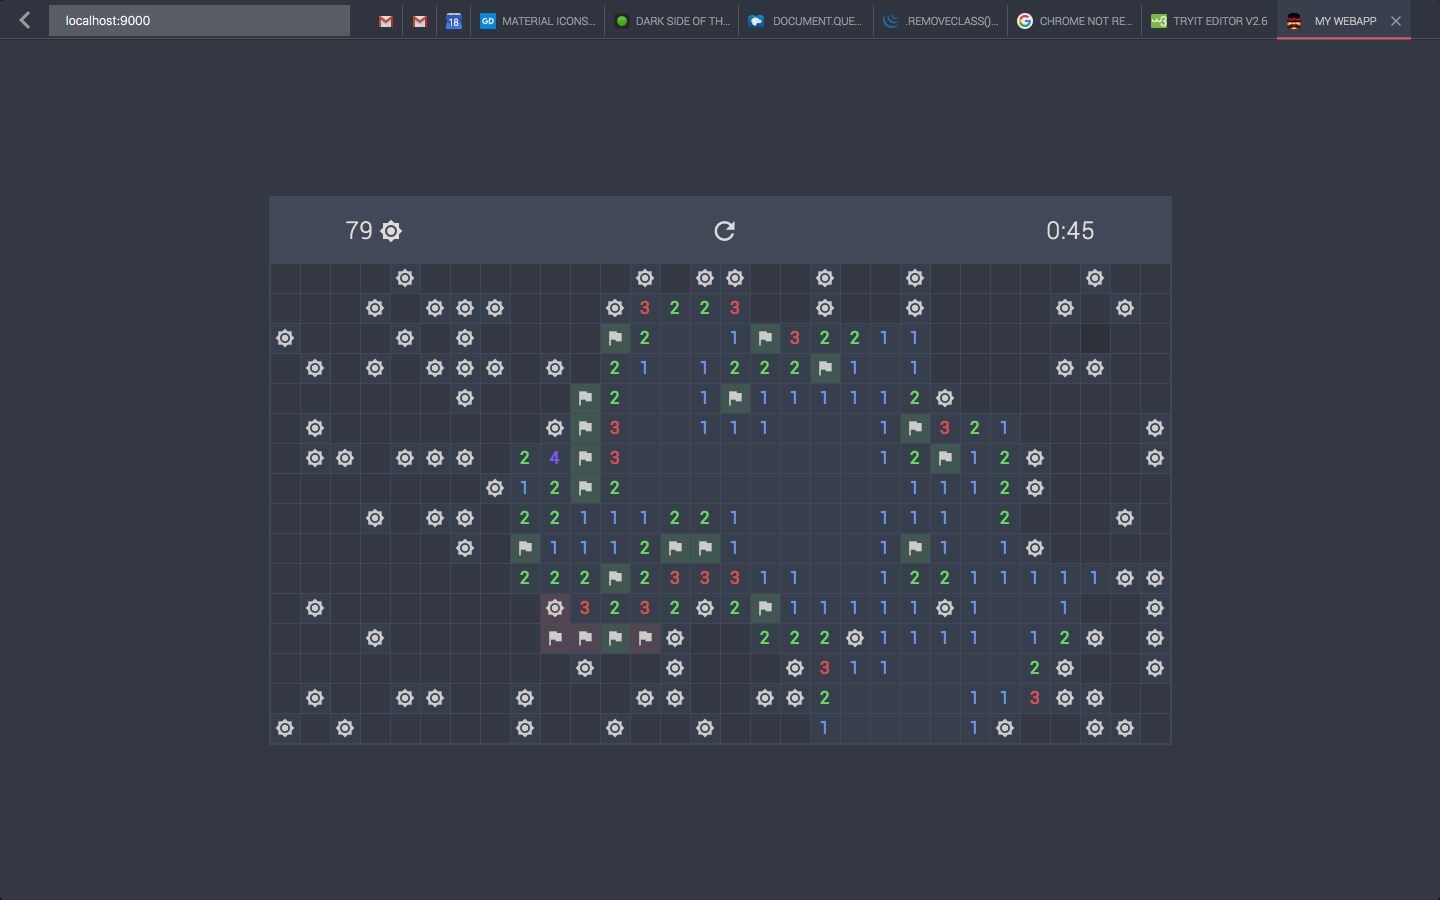
When the user messes up, all of the ramining bombs show up in white.
If the user manages to clear all of the bombs, a message pops up saying that they've won and the current time, along with a button to restart. 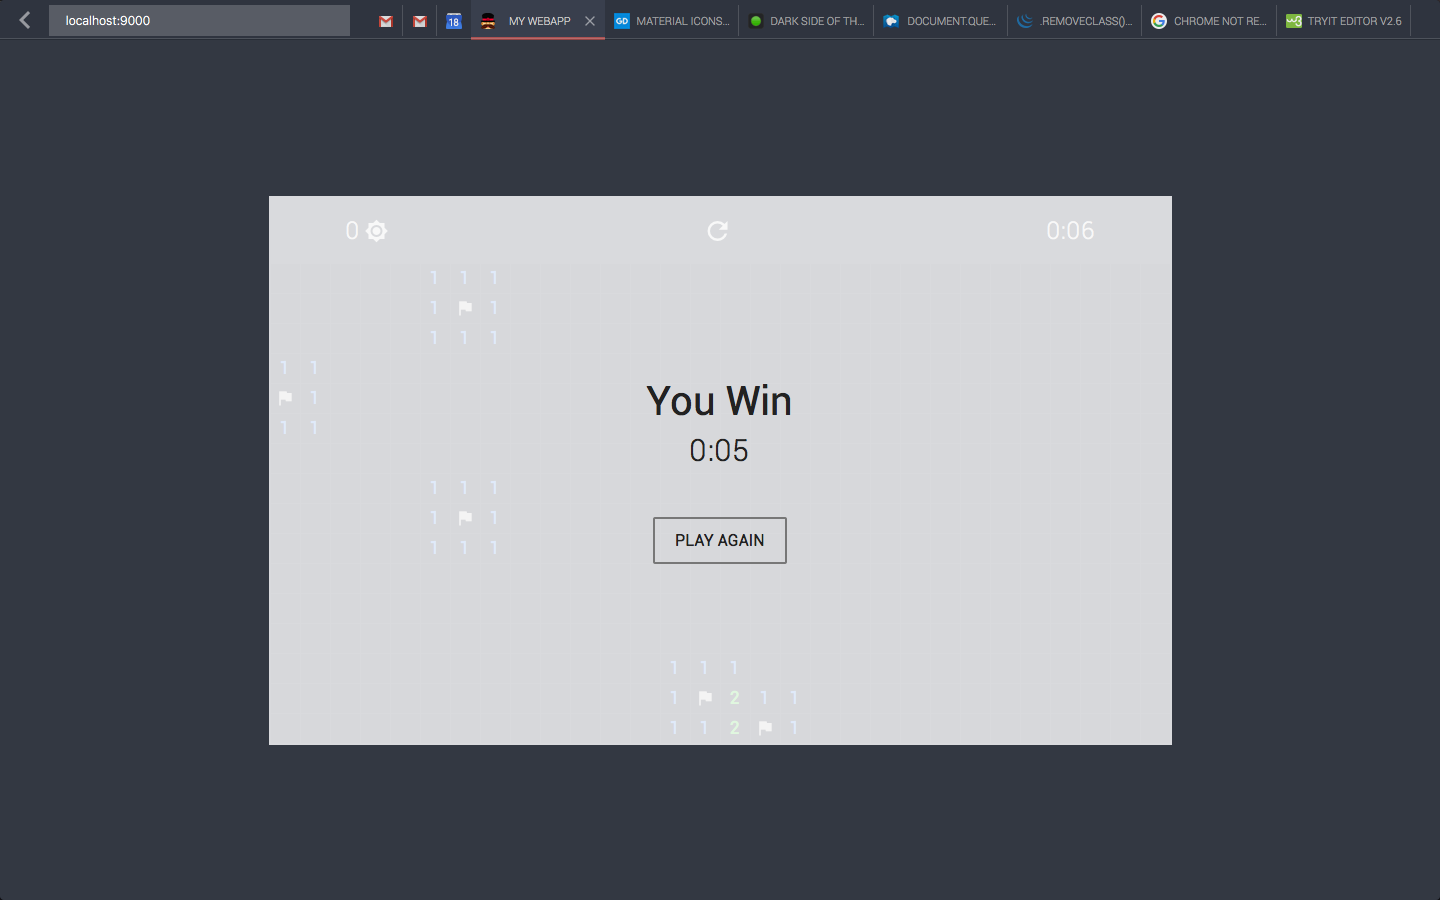
TICTACTICS PROCESS
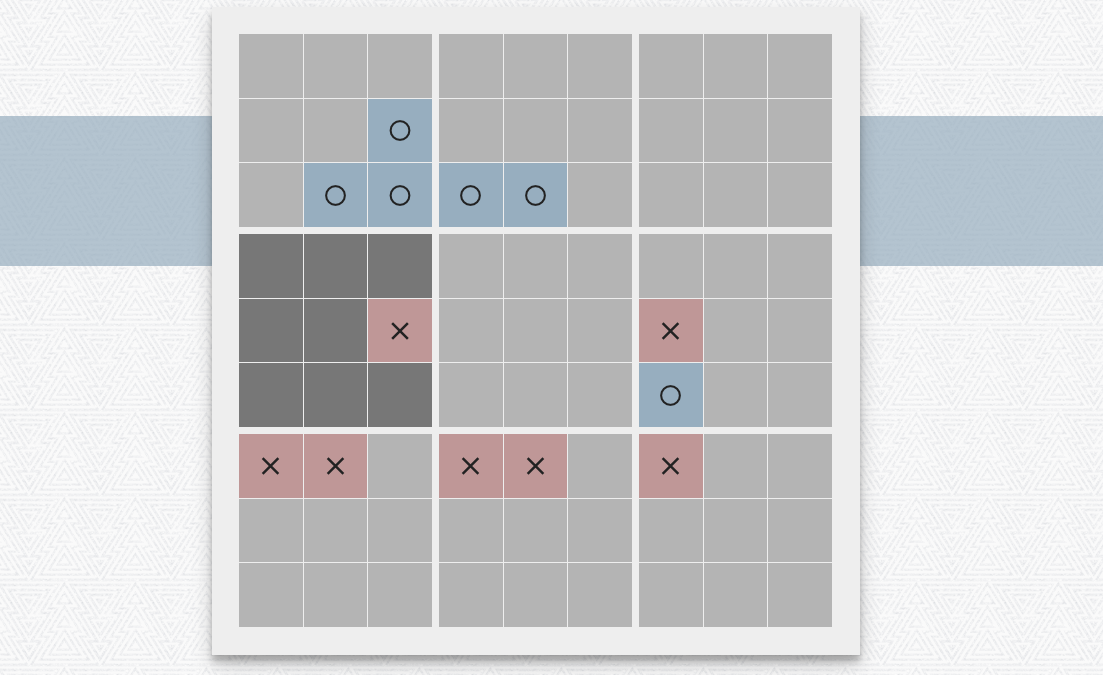
Unlike with Minesweeper, I manually created the 81 html elements for each of the squares using copy and paste. The tictactics board itself was represented as a 2D array of individual tic tac toe boards, which in turn each contained a 2D array of tiles, a 4D array if you will. A ripple animation is shown whever the user clicks on a tile, and the icon ('X' or 'O') is animated into the tile. Tiles are lighter when the user cannot make a move on that tile, and darker when they can.
URL sharing mode works by saving moves to the same game location on the server, and refreshing the game on both clients every second or so. Additionally, the banner in the background changes color based on the current turn.